Stack Dyno
Reseller PortalFinOps AgentCloud Map

sign in

Back to blog
Feb 11, 2025

API unit economics scoreboard for Google Maps, Identity, and Vertex AI

Track billable API costs per request and stop margin leaks before invoices land.

APIs
Unit Economics
Google Cloud
API unit economics scoreboard for Google Maps, Identity, and Vertex AI

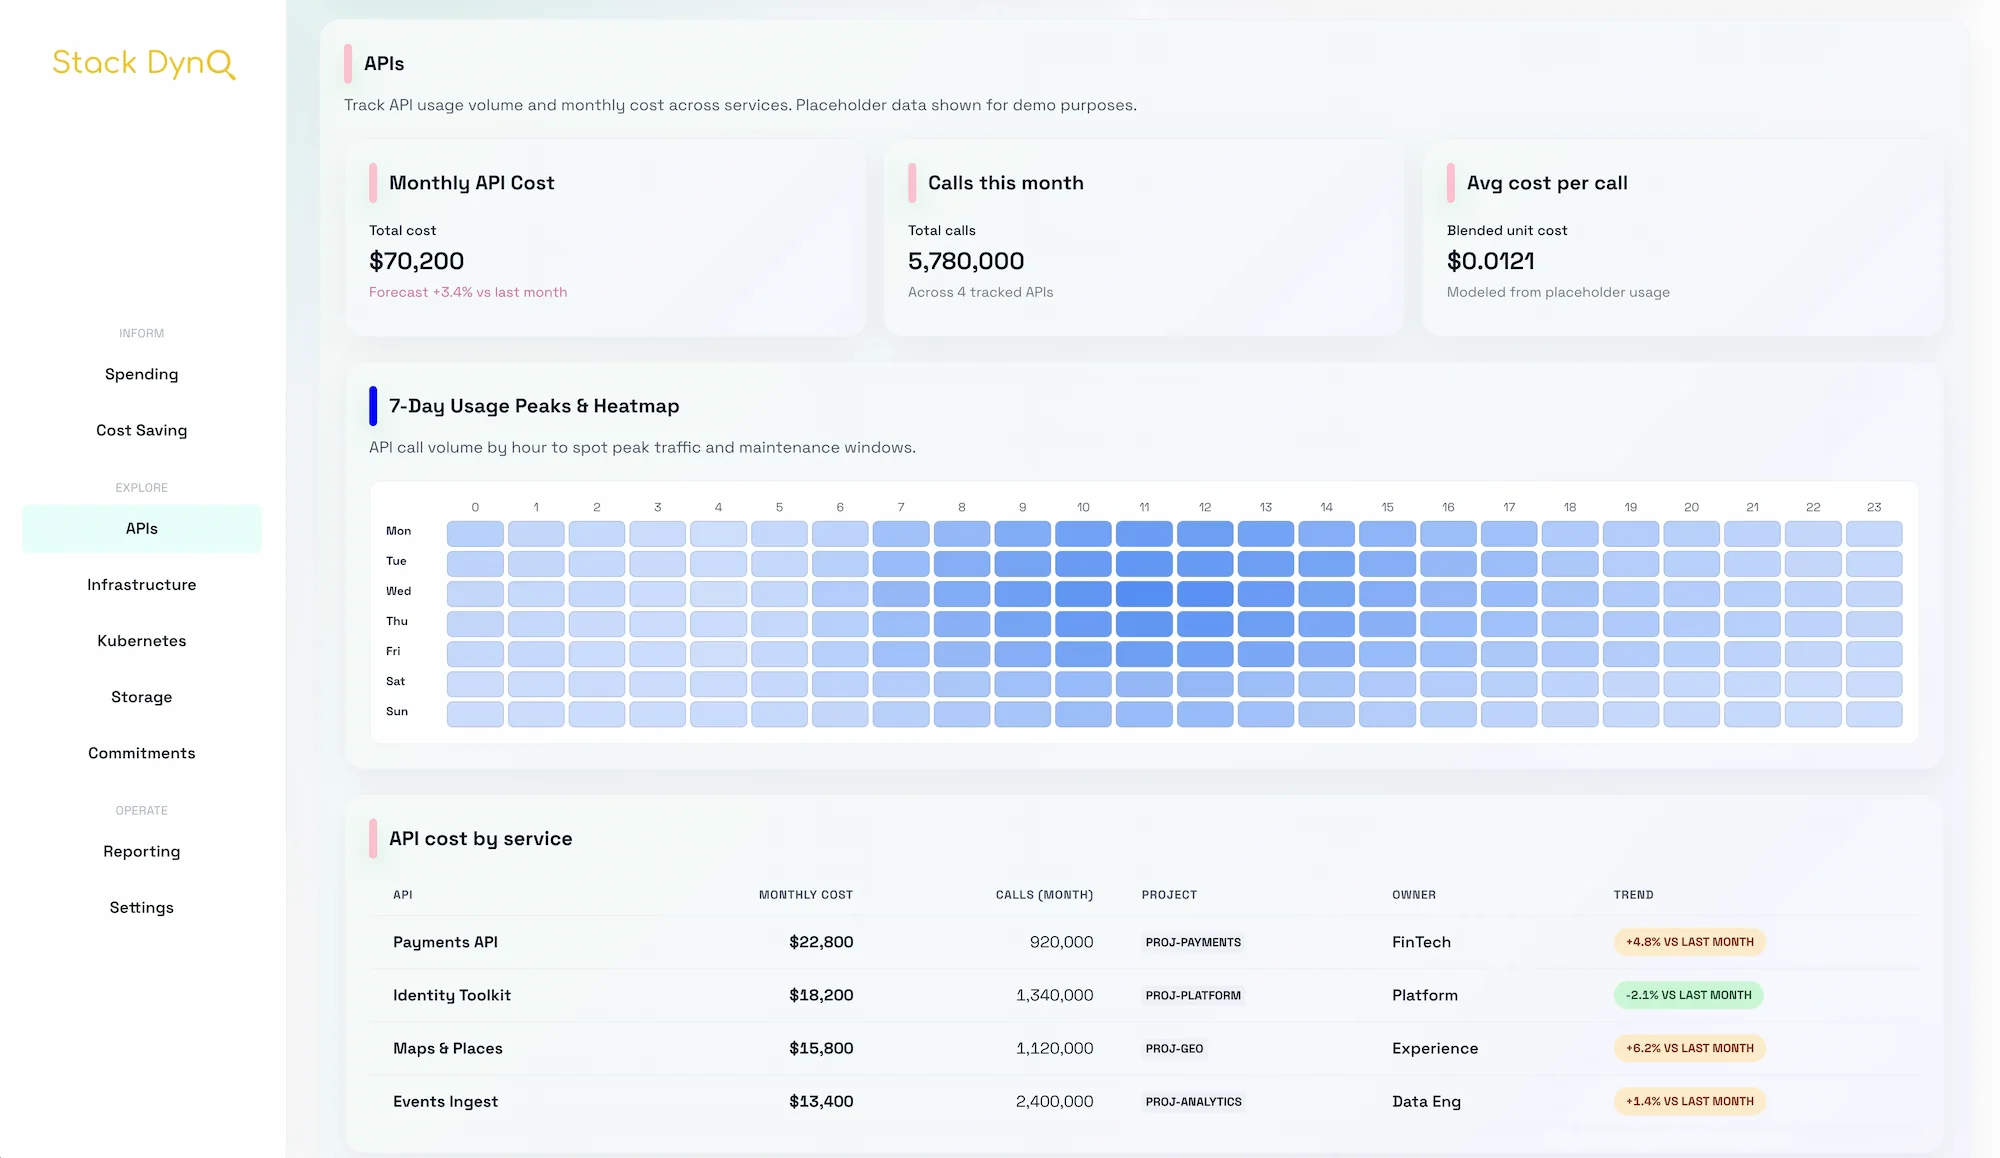
Billable APIs are sneaky: usage looks small until the invoice lands. A clear unit-economics scoreboard keeps Google Maps, Identity, and Vertex AI costs aligned with customer value—and protects reseller margin in the process.

Why APIs break reseller margin

Before opening a dashboard, tell the story in plain language. That context keeps optimization from feeling like finger-pointing.

  • High request volumes hide behind low per-call prices, creating big surprises during promotions or traffic spikes.
  • Identity and auth workflows can double-charge across regions if routing is not tuned.
  • Product teams rarely see their cost per transaction in real time, so bad defaults stay in production longer than they should.

Build an API unit economics scoreboard in Stack Dyno

Think of the scoreboard as a shared contract between product, SRE, and finance. It needs clear inputs and a cadence everyone can rely on.

  • Connect billing exports and label API projects with owners, environments, and customer segments.
  • Define target cost-per-call thresholds by API, region, or request type to match your pricing model.
  • Set anomaly alerts that watch for spikes in quota usage, error retries, or geographic egress.
  • Publish a weekly “API health” report that sales and PMs can read without a FinOps translator.
import { createApiScoreboard } from './sdk';

const scoreboard = await createApiScoreboard({
  billingAccount: 'XXXX-YYYY-ZZZZ',
  apis: [
    { name: 'Maps', targetCostPerCall: 0.002, owner: 'geo-platform' },
    { name: 'Identity Toolkit', targetCostPerCall: 0.001, owner: 'auth-team' },
    { name: 'Vertex AI', targetCostPerCall: 0.05, owner: 'ml-platform' },
  ],
  alerts: {
    destination: 'slack',
    channel: '#api-costs',
    triggers: ['cost-per-call', 'egress', 'error-retries'],
  },
});

Signals to review weekly

After the scoreboard is live, lightweight rituals keep it useful instead of ornamental.

  • Top 10 endpoints by spend and by variance to see where optimization will pay off fastest.
  • Cost-per-call outliers caused by retries, inefficient payloads, or poor caching.
  • Egress hotspots from multi-region calls or unpinned client locations.
  • Heatmaps of calls by hour and region to spot patterns that suggest smarter routing.

Packaging updates for customers

Customers appreciate brevity when you bring evidence. Keep the human tone intact.

  • Send a weekly Stack Dyno report with three bullets: biggest variance driver, action taken, and forecasted savings.
  • Keep a running optimization queue—rate limiting, response compression, or caching—that account teams can share as value adds.
  • Use the API cost tracking dashboard during QBRs to show proactive control over Maps, Identity, and Vertex AI spend.

APIs power customer experiences, but they should not erode your margin. Stack Dyno gives resellers a live scoreboard, anomaly routing, and customer-ready reporting so API costs stay predictable and profitable.


Thanks for reading. Share feedback or ask for deeper dives on any topic.

View Stack Dyno